Feature - Self Designed Reports
Standard templates often miss the nuanced details you need for strategic decisions. Self Designed Reports in TrackonAI allow you to tailor analytics to your exact requirements, with no specialized coding or external tools necessary.
Build custom queries, filter data by region or commodity, and visualize results with easy-to-use charts or pivot tables. Easily export these bespoke reports to PDF or Excel for sharing with stakeholders.
-
Drag & Drop Builder
Choose data fields like trade date, margin, or contract status. Arrange them into a custom layout for clear, focused insights.
Drag & Drop Builder
No Coding RequiredInstant PreviewCustomizable LayoutsEasy to Modify -
Interactive Filters
Narrow down large datasets by commodity, location, timeframe, or any relevant parameter, right from the report interface.
Interactive Filters
Dynamic SearchesRefine on the FlyMulti-Level CriteriaReal-Time Updates -
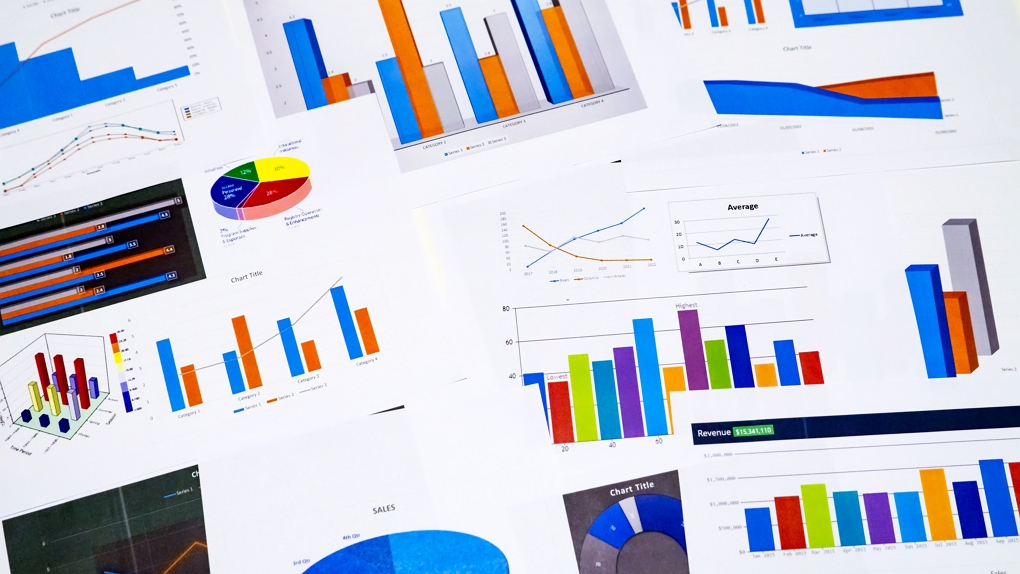
Visual Charts & Pivot Tables
Transform raw data into actionable graphs, bar charts, or pivot tables to spot trends and outliers faster.
Visual Charts & Pivot Tables
Charts & GraphsPivot Table AnalysisTrend DetectionQuick Comparisons -
Export & Share
Download your custom reports as Excel, PDF, or CSV files, or share them directly with team members in TrackonAI.
Export & Share
Multiple FormatsBoard-Ready PDFsTeam CollaborationArchived Reports
Self Designed Reports empower every department, from finance and operations to risk management, to slice and dice data however they see fit. Free yourself from rigid templates and unlock deeper insights into your trading performance.